雅思写作考试中小作文部分相对来说更加简单一些,考试的题型比较固定,包括常见的饼图、折线图、柱形图等等。今天雅思培训机构小编为大家分享的是雅思折线图小作文模板及范文,大家可以通过有效的练习掌握模板的使用方法。
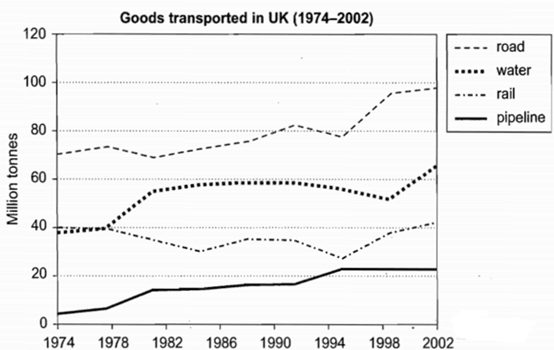
The graph below shows the quantities of goods transported in the UK between 1974 and 2002 by four different modes of transport.Summarize the information by selecting and reporting the main features,and make comparisons where relevant.
Write at least 150 words.

折线图范文参考
The line graph demonstrated to us the change in capacity for four types of transportation over goods from 1974 to 2002 in UK.
In general,goods transported in all four modes has increased.Pipeline is the leader in this surge,with a 4.5 times increase from 5 million tones in 1974 to around 24Mt in 2002.Road transportation nearly doubled its capacity,increasing from 50Mt to almost 100Mt.Waterway transportation ranks the third,with a 50%increase from 40Mt to more than 60Mt.Railway,on the other hand reaches an almost-equal slight increase throughout the 28 years.
The figure indicates that all transportation modes that requires motors(trucks,vans,locomotives,boats or ferries)suffered from a down-slide in the 1990s.However,Pipeline,requiring no motors at all,is steadily boosting its capacity.There must have been some problems over motorway,railway or waterway construction,or a large-scale resource crisis for the motors at that time.
以上是小编为大家分享的雅思折线图小作文模板,各位考生可以结合练习进行掌握,小编希望本套模板能帮助大家在考试中快速进行答题。