2019年6月22日小作文题目,国内(A类):柱图

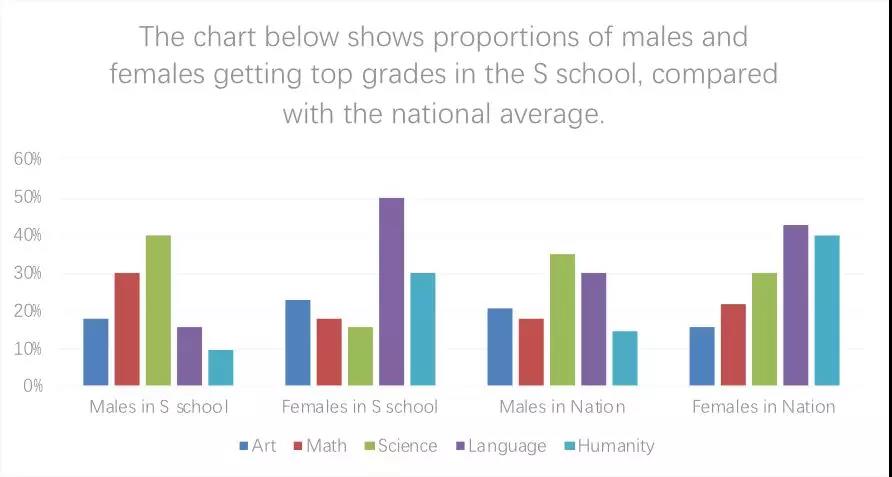
The chart below shows proportions of males and females getting top grades in the S school, compared with the national average.
数据之间的比较关系
“同时不同项”:在同一个时间点上,不同科目,不同性别,学校均值和全国均值
数据分组:性别之间:组1比组2;组3比组4。学校均值和全国均值:组1比组3;组2比组4。不同科目:描述每个组的具体情况时自然会写到。
The bars are the illustrations of the performance of male and female students in obtaining top grades in S School, and the performance is compared with the national average.
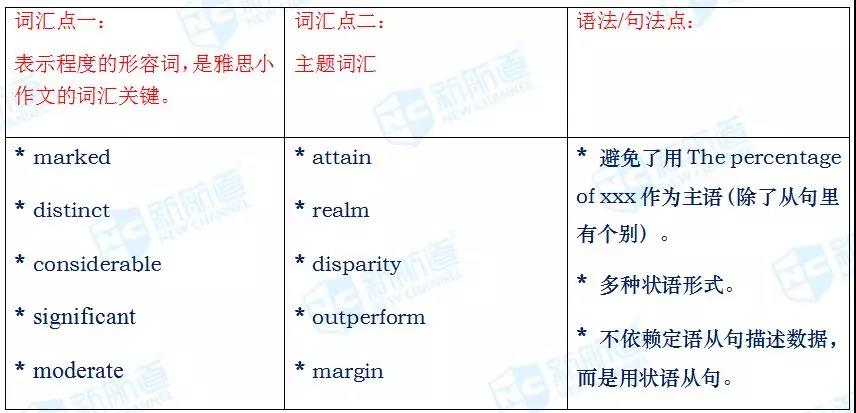
In this school, Science, language subjects and Humanity are three areas where there are marked differences between males and females, ← 总,分 [挑出差异的一个科目,并且交代男女之间的数据关系,别的细节省略。] → and the difference is most distinct [表示程度的形容词,是写作的词汇关键] in language subjects, where 50 percent of females attain top grades, and the percentage is more than three times of that of males. Nationwide, there is a different pattern. ← 总 [借助前面建立起来的语境写,different这个词的含义是指接下来的内容是针对前文内容而来的。],分 → The only realm where the disparity is considerable is Humanity, as females outperform males by a huge margin of 25 percent.
The school, its male students, to be exact, performs better than the national average in Math (30 percent to 18 percent nationwide) and less good than national average in language subjects (15 percent to 30 percent) ← 分,总 → and these are the obvious differences. As for females, Science is where the gap is largest. ← 总,分→ As 30 percent of females achieve top grades on the national scale and only 16 percent of the school’s female students achieve the same level, ← 分,总 → School falls behind.

Overall, in terms of both scale and gender, the variation is significant in some subjects and moderate in others. [数据规律不凸显的时候,就笼统写]