隔了一场线图,再次遭遇“不同年份且不同地区”的柱图,还混进一个饼图凑热闹……
2019年5月4日雅思小作文题目
国内(A类):柱图+饼图


高分范文及解析
如何避免“机械罗列数据”的写法?
写出数据背后的事实,用“解读”(不是探讨原因)的方式去写“数据体现出来的事实”
【重要一】对于数据的省略要“大胆”。考官不是通过写作的文本来画图,而是审核写作文本是否符合图中的信息和意义。
【重要二】避免“机械罗列数据”的写法:写出数据背后的事实,用“解读”(不是探讨原因)的方式去写“数据体现出来的事实”。
给各位“烤鸭”打个样儿(仅看body部分):
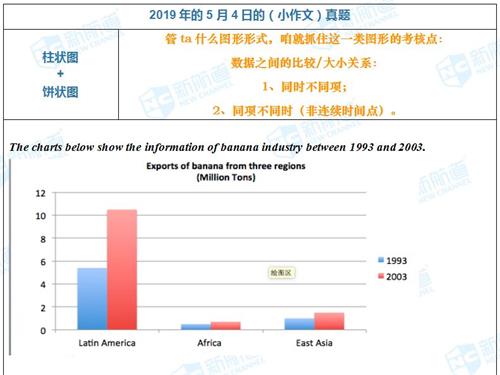
The distinction between Latin America and the other two regions – Africa and the slightly bigger exporter East Asia – was clear, as Latin America sold to the international market far more tonnage of bananas than did the other two regions. In the two years, the respective sales were 5.5 million and 10.5 million tons, and they could be more than ten times of the sales in the other two regions.
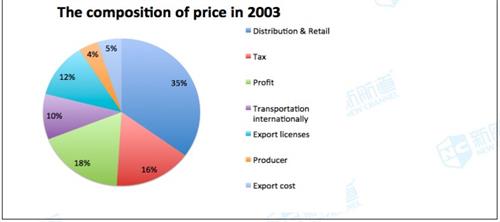
Most conspicuously, when a ton of bananas are sold at the retail price, farmers make a mere 4 percent of the price, far less than the profit margins, which were more than four times of the production cost. Another small part of the price was the export cost, and tax, cross-border transportation and cross-border transportation accounted for moderate portions. The rest 35 percent is cost by distribution and retail.
注意题目中的主题词汇(比如本文中的exporter, sold to the international market, profit margins, cross-border transportation, cross-border transportation)也是有替换的空间的。