统计学是什么?
是“计算平均值、平方差”的?是“用来做抽样调查”的?是“画回归方程,做模型估算”的?
或许有很多已经考完SAT或是高中毕业的同学再被问题这个题,还是无法准确说出其定义。
简单来讲,统计学就是研究数据的收集、整理和分析的一门学科。由于每门考试涉及的考点和范围不同,导致同学们对统计的理解只停留于已学习的部分,比如用抽样来收集数据、用均值等统计指标来整理、用回归模型来做预测和分析等。因此,我们将以上的回答串成一句话,“通过做抽样调查或实验收集数据,计算其均值等指标,再作出对应的回归方程,最后运用该模型对未来事件进行预测和分析”,这样其实也算是通俗的解释了统计学的定义。
那今天我们就来捋一捋SAT数学中统计学部分的重要考点吧。
(一)数据获取和收集
总体和样本(population and sample)
总体是根据研究的所确定的观察单位某特征的集合,即研究对象的所有数据。而样本便是从总体中抽出的部分数据集合。
抽样方法 (sampling methods)
在确定观察目的和对象之后,就要开始对抽样方法进行设计,例如样本大小、样本选取范围、通过怎样的方式得到数据等等。
参考例题
A researcher representing a city government wants to measure public opinion about recycling by asking 1,000 randomly selected residents a series of questions on the subject. Which of the following is the best description of the research design for this study?

A. Observational study
B. Sample Survey
C. Controlled experiment
D. None of the above
抽样结果
当然,并不是所有设计的抽样方式都能保证结果合理,要能通过分析来判断样本的有偏和无偏性。
A political scientist wants to predict how the residents of New Jersey will react to a new bill proposed in the state senate. Which of the following study designs is most likely to provide reliable results for the political scientist?

A. Mailing a questionnaire to each of 200 randomly selected residents of New Jersey
B. Surveying a group of 300 randomly selected New Jersey residents
C. Interviewing a group of students randomly selected from a large public university in New Jersey
D. Surveying a group of 1500 randomly selected US residents
参考例题
(二)数据整理和计算
计算统计学的相关指标,例如均值、众数、中位数、方程、标准差、范围、四分位差等。
描绘统计学的相关图表,例如散点图、柱状图、茎叶图、饼图、箱线图等。
参考例题
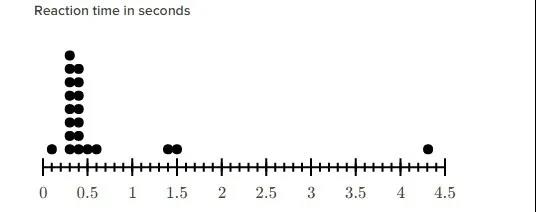
A class tested their reaction times to catch a falling object. The dot plot above gives their results, to the nearest tenth of a second. Which statement best compares the median and the mean for this data?
A.The mean is greater than the median.
B.The median is greater than the mean.
C.The mean and the median are about the same.
D.There is not enough information to determine the mean
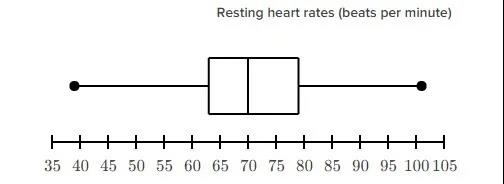
The box plot above summarizes the resting heart rates, in beats per minute, of the members at a gym. What is the range of resting heart rates?
A. 16 beats per minute
B. 31 beats per minute
C. 62 beats per minute
D. 70 beats per minute
参考例题
(三)数据分析和推断
散点图和回归模型
通过散点图将收集的数据以清晰明了的图像形式展现,再依照趋势去描绘近似的回归曲线,并计算出相应的模型数据。
分析和预测
利用估计的模型对未来的数据进行预测和分析。(注意预测的数据不可远超过模型数据,否则会导致“外推错误(extropolation)”)
参考例题
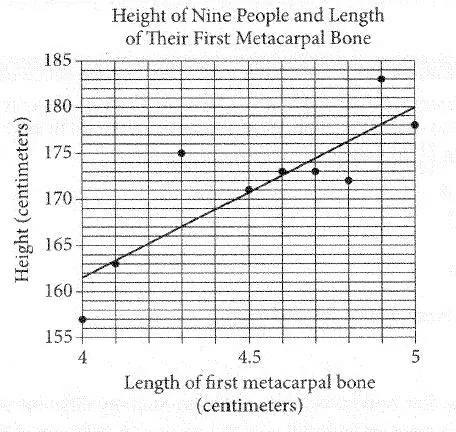
The first metacarpal bone is located in the hand. The scatterplot below shows the relationship between the length of the first metacarpal bone and the height of 9 people. The line of best fit is also shown.
(1) How many of the 9 people have an actual height that differs by more than 3 centimeters from the height predicted by the line of best fit?

A. 2
B. 4
C. 6
D. 9
(2) Which of the following is the best interpretation of the slope of the line of best fit in the context of this problem?
A. The predicted height increase in centimeters for one centimeter increase in the first metacarpal bone
B. The predicted first metacarpal bone increase in centimeters for every centimeter increase in height
C. The predicted height in centimeters of a person with a first metacarpal bone length of 0 centimeters
D. The predicted first metacarpal bone length in centimeters for a person with a height of 0 centimeters
(3) Based on the line of best fit, what is the predicted height for someone with a first metacarpal bone that has a length of 4.45 centimeters?
A. 168 cm
B. 169 cm
C. 170 cm
D. 171 cm
通过今天的加餐,同学们对统计学有没有更深的认识和理解呢?
其实不论是统计、代数、还是几何,任何一个模块的学习都不能仅停留于考题本身,要去多了解其本质含义,这样才能完全理解吸收,并且帮助更快的记忆所有的公式、掌握解题技巧。更多SAT相关干货